We know testing your luteinizing hormone levels and testing for ovulation daily, especially when you have long cycles, can get tiring. We also know that when it comes to charting for fertility, things get complicated fast. It’s easy to feel lost when faced with LH testing, basal body temperature readings, and cervical mucus observation.
Know that you aren’t alone!
Many women who are trying to conceive find this process a bit daunting. But stay strong because the daily practices of tracking and charting provide valuable information about how your body operates and your LH charts and ovulation charts can give you the fertility or infertility information you need.
If you’ve ever wondered how your charts compare to normal charts, average charts, or even abnormal charts, you’re in luck. This article walks you through LH chart examples and ovulation chart examples you can use to better understand your cycle data.
Tracking Your LH Levels
If you’ve read our articles on getting pregnant fast, then you understand how important tracking your LH levels can be when trying to conceive — and there can be a great deal of variances in LH patterns, some of which can indicate an issue, or at least an obstacle, to conception.
The two normal patterns of LH surges are gradual onset LH peak మరియు rapid onset LH peak.
- A gradual LH surge pattern will slowly rise over 1-6 days of your cycle.
- A rapid LH surge pattern will quickly rise in just one day.
When women were studied, it was found that 57.1% had a gradual onset greater than one day, and 42.9% of women had a rapid onset. Let’s look at a few charts and see how this affects testing and conception.
Rapid LH Surge Chart Example
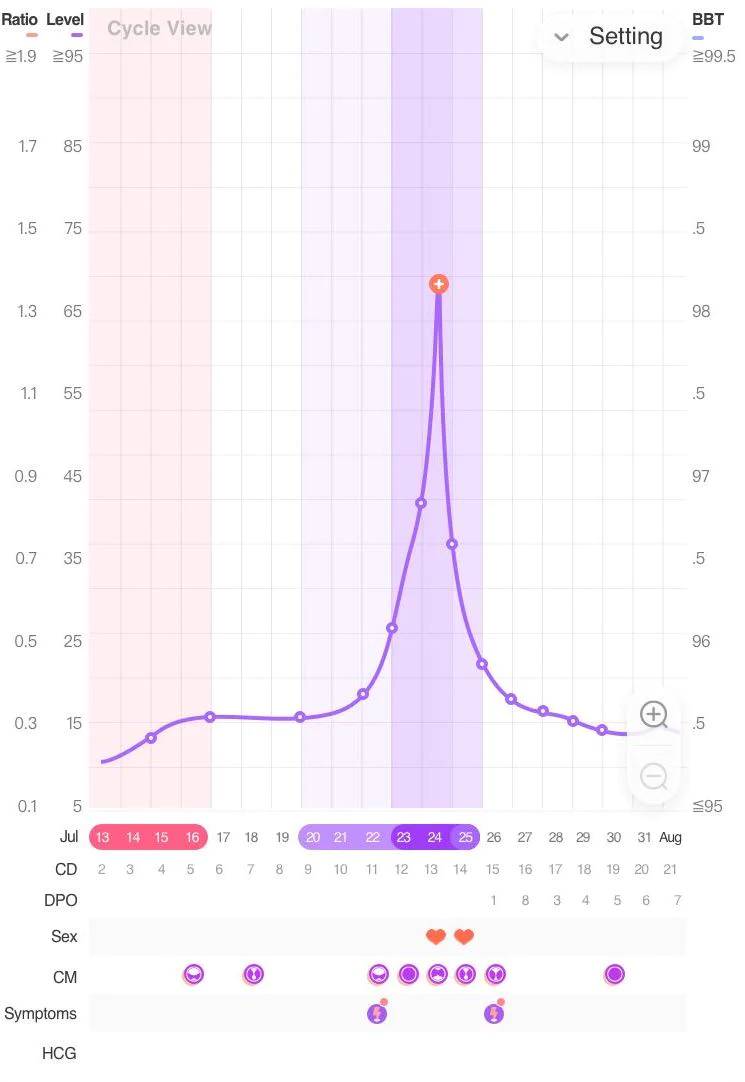
When you look at the chart below, you can see several days of LH (luteinizing hormone) testing without much rise and fall. However, on cycle day 13 (CD 13) there was an enormous spike in LH levels.
ఆదర్శవంతంగా, ఈ ఉప్పెన నమూనా ఉన్న స్త్రీ ప్రతిరోజు అంచనా వేయబడిన సంతానోత్పత్తి సమయంలో LH స్థాయిలను ట్రాక్ చేస్తుంది, మరియు బహుశా ముందుగానే. వేగంగా ప్రారంభమయ్యే LH ఉప్పెన ఉన్న మహిళలకు, ఒక రోజు ట్రాకింగ్ లేకపోవడం అంటే గరిష్ట స్థాయిని కోల్పోవడం అని అర్థం. వారు జాగ్రత్తగా లేకపోతే, బేసల్ శరీర ఉష్ణోగ్రత (BBT) పెరుగుదల తరువాత సూచించే వరకు అండోత్సర్గము జరిగిందని వారికి తెలియకపోవచ్చు.
If you haven’t found an LH peak, it may be a good idea to test twice daily for 1-2 cycles to ensure you’re not missing a rapid rise!
Also visible in this chart example is the timing of intercourse, which was timed appropriately for peak day and ovulation day — CD13 and CD14. Sexual activity should be targeted throughout the fertile window (seen in purple). In this example that would include CD9-CD15, which includes the day after suspected ovulation on CD14.
While the example shows some appropriately timed fertile cervical mucus (CM), unfortunately, there is no basal body temperature tracking included, so it would be difficult to know if the LH peak truly resulted in successful ovulation.
Gradual LH Surge Chart Example
A gradual LH surge is the most commonly referenced cycle pattern. The sample gradual surge chart below is a great example of daily tracking to ensure the surge is not missed. You can see that the LH levels do bob up and down at a low level for a few days, then gradually begin a steady increase in CD 11-CD 13. You’ll also notice that on CD14, CD15, and CD16, the LH levels have lowered again, which means you can feel confident a peak has been found.
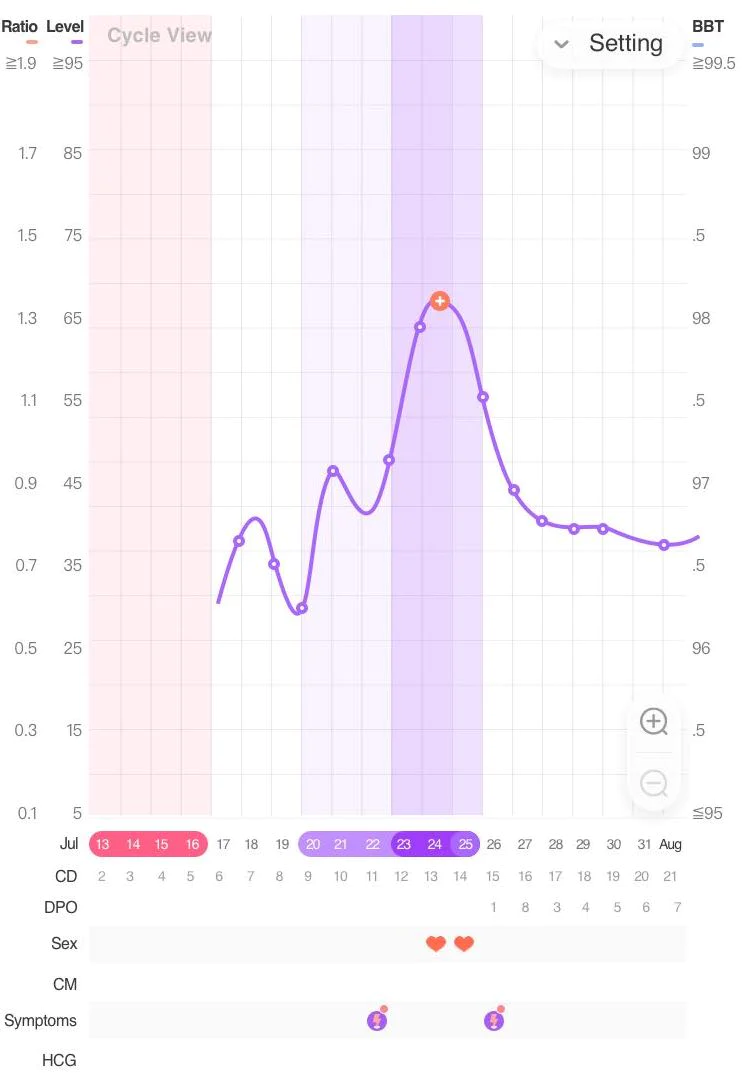
This example also includes intercourse on ovulation day and the day before, but it would be more effective to have intercourse well before the LH peak, starting on CD9. Having sperm present before your peak day helps ensure your chances of conception.
అదనంగా, ఈ ఉదాహరణ చార్ట్ గురించి ఒక వింత పరిశీలన ఏమిటంటే, LH శిఖరానికి ముందు సారవంతమైన శ్లేష్మం గుర్తించబడలేదు. సారవంతమైన శ్లేష్మం లేకుంటే, LH శిఖరం ఉన్నప్పటికీ, అది ఫోలిక్యులర్ దశలో సమస్యను సూచిస్తుంది. BBT మరియు PdG ట్రాకింగ్ అండోత్సర్గమును గుర్తించగలవు మరియు hCG ట్రాకింగ్ గర్భధారణను గుర్తిస్తుంది.
నా LH సర్జ్ ఈ నమూనాలకు సరిపోకపోతే ఏమి చేయాలి?
If your LH surge doesn’t seem to fit either of the above patterns — gradual LH surge or rapid LH surge — it may look like the example chart below.
At first glance, this chart may not look abnormal, but it does highlight some issues with LH. You can see the LH was tested every day to ensure a peak was not missed, however, you can also see that there wasn’t one significant LH peak day. On CD13 and CD15 there are little mini peaks, but nothing monumental.
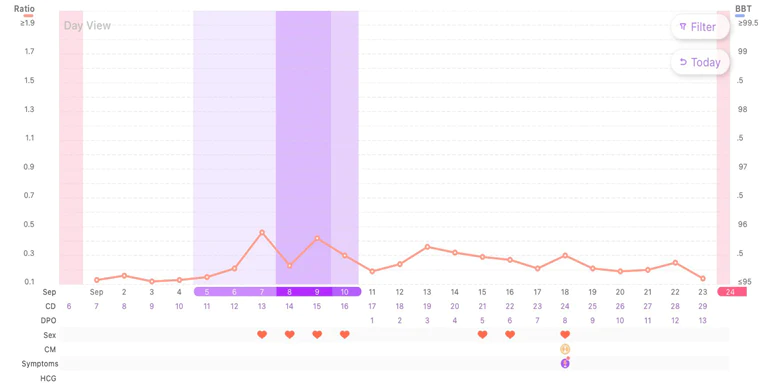
While rare, there is a slight chance this user was very overhydrated on her peak days, and the LH sample was diluted so significantly that it made LH levels appear lower than they were. This is a great reminder to keep your water intake consistent daily so that samples aren’t ultra-concentrated one day and super diluted another day.
ఈ సందర్భాలలో, BBT ట్రాకింగ్ను జోడించడం ఎల్లప్పుడూ ఉపయోగకరంగా ఉంటుంది, ఎందుకంటే BBTలో పెరుగుదల అండోత్సర్గమును సూచిస్తుంది. అండోత్సర్గమును ప్రేరేపించడానికి సరైన LH స్థాయి లేనప్పటికీ, ఈ చార్ట్ యొక్క నమూనా అండోత్సర్గమును ప్రేరేపించడానికి తగినంత LH కార్యాచరణ యొక్క అసంభవాన్ని సూచిస్తుంది.
If your chart looks like this, it may be worth a conversation with one of our fertility specialists in a Premom virtual fertility consultation. Check your Premom app to see all of the options available.
Tracking Charts Can Highlight Fertility and Infertility
Both of the charts shown above demonstrate the positive practice of consistent testing! Even with minor peaks, ovulation testing continued to ensure a late LH surge was not missed. Just as we walked you through those charts, we’re going to take a look at some sample ovulation charts so you can:
- See how your chart compares to a “normal” cycle chart or if your cycle looks more similar to someone with PCOS or with short cycles.
- See examples of good cycle tracking and charts that show promising results for ovulation, intercourse timing, and chances of conception.
- Learn what makes for an idyllic conception cycle and review some common irregular chart patterns.
Normal Menstrual Cycle Chart Example
There really is no such thing as a normal menstrual cycle. We can, however, identify what the average patterns look like that most often result in successful conception. If your cycle doesn’t match the average exactly, it doesn’t mean you can’t get pregnant. It means you may have some unique variances that should be continuously monitored to optimize fertility.
- Average cycle length tends to be between 21-35 days.
- LH (luteinizing hormone) tends to surge between days 10-16 on average and is where the most variance in cycle length typically exists.
- The luteal phase, or the second half of the menstrual cycle after ovulation, is more consistent among women and is typically around 11-16 days long.
The example chart below shows a 32-day cycle with a 13-day luteal phase, which tells us there would have been plenty of time for implantation of a fertilized embryo if trying to conceive. You can see that ovulation tests have been tracked every day, which is particularly important because of the abrupt rise in LH. If you have a chart that looks like this, it’s easy to miss your peak if you’re not diligently tracking.
Another thing that makes this cycle example gorgeous is the intercourse timing, which occurred before ovulation. With sexual activity timed as LH is rising, a woman can feel confident that sperm are present during ovulation.
బేసల్ శరీర ఉష్ణోగ్రత ట్రాకింగ్ కూడా చాలా స్పష్టంగా మరియు స్థిరంగా ఉంటుంది. ఇది చాలా ముఖ్యం ఎందుకంటే ఇది అండోత్సర్గము జరిగిందని సూచించడంలో సహాయపడుతుంది. అండోత్సర్గము జరగకపోతే, లూటియల్ దశలో మీ శరీర ఉష్ణోగ్రతను పెంచే ప్రొజెస్టెరాన్ అనే హార్మోన్ను స్త్రీ ఉత్పత్తి చేయదు.
ఈ చార్టులో చూడవలసిన చివరి వివరాలు గర్భాశయ శ్లేష్మం ట్రాకింగ్ యొక్క ఫ్రీక్వెన్సీ. అండోత్సర్గము ముందు మరియు సమయంలో గుడ్డులోని తెల్లసొన సారవంతమైన శ్లేష్మం ఉండటం ద్వారా గర్భాశయ శ్లేష్మం యొక్క దగ్గరి రికార్డును మరింత గుర్తించవచ్చు.
If you have a cycle similar to this example and did not get pregnant while trying to conceive, know that you did all the right things in cycle mapping, tracking, and intercourse timing. It could be that a non-hormonal IUD or protection was used, or simply conception did not occur during this particular cycle for unknown reasons.
Remember, if you’re younger than 35, you only have a 25-30% chance of conceiving each cycle in perfect conditions, so it’s important to stay consistent with your tracking each month!
Abnormal Ovulation Chart Examples
Now that you know what an outwardly idyllic cycle looks like, let’s take a look at abnormal cycle chart examples.
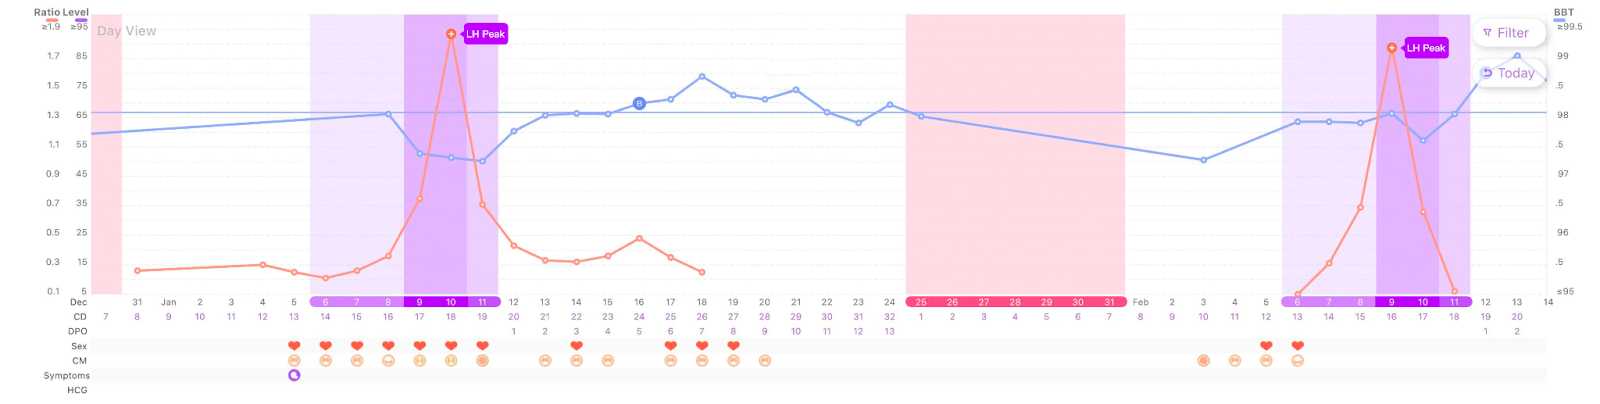
The sample chart below demonstrates a fantastic job tracking LH levels and BBT and adequate intercourse timing. You can see an LH peak, which seems promising, but when you take a closer look, there are some underlying issues.
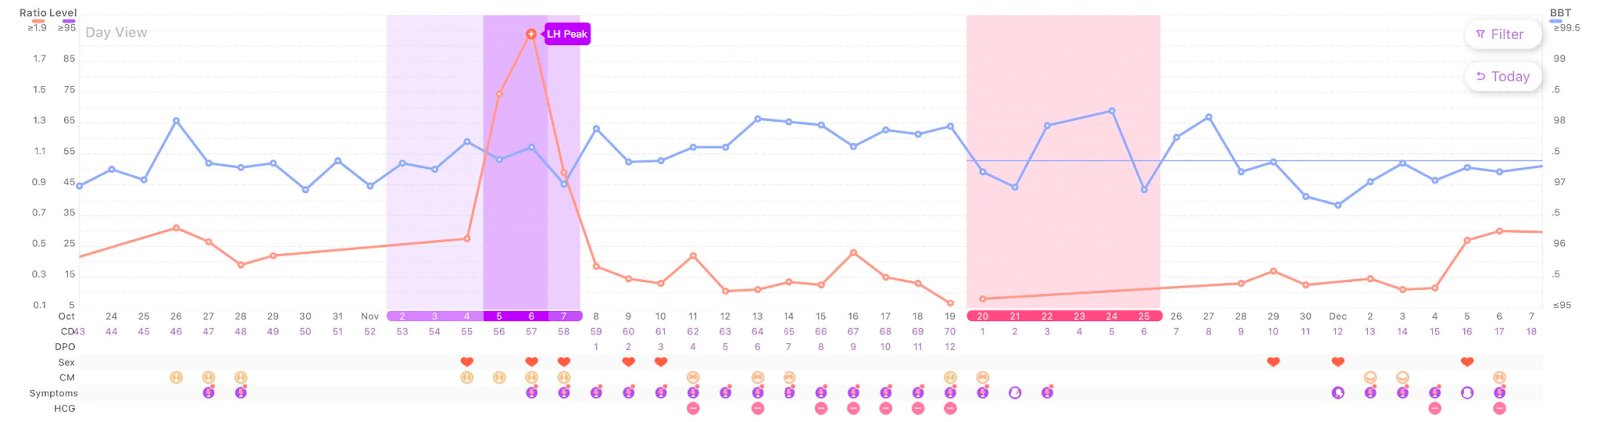
Although you see an LH peak and a period 12 days later, there isn’t a significant thermal shift in the luteal phase of the cycle. This minimal increase in BBT makes us suspect that although LH peaked, ovulation may have not occurred. This may mean that for some reason the brain and ovaries weren’t communicating well. The brain is secreting luteinizing hormone (LH) telling the ovaries to ovulate, but the egg may have not actually been released this cycle.
ఈ చక్రంలో ప్రొజెస్టెరాన్ పరీక్ష స్ట్రిప్లకు ప్రతికూల ఫలితాలు వస్తే, అండోత్సర్గము జరగలేదనే మా అనుమానాన్ని మరింత బలపరుస్తుంది.
Pregnancy tests are also included and hCG testing is shown in the chart to start just 4 days past suspected ovulation, but typically hCG levels are not detected until about 10-12 days post ovulation.
అది ఎందుకు? ఇది PCOS లేదా హైపోథైరాయిడిజం కావచ్చు?
ఈ చక్రం, 70 రోజుల పాటు, అసాధారణంగా సుదీర్ఘమైనది. తరచుగా ఈ సైకిల్ నమూనా PCOS లేదా నిర్వహణలో లేని థైరాయిడ్ సమస్యను సూచిస్తుంది. కాబట్టి, ఈ ఉదాహరణలో ట్రాకింగ్ చక్రాలను కొనసాగించడం చాలా అవసరం అయితే, కొన్ని ఆహార మార్పులు - మరియు బహుశా వైద్య ప్రదాతతో హార్మోన్ స్థాయిల పరిశోధన - కూడా సిఫార్సు చేయబడవచ్చు. సంతానోత్పత్తి నిపుణుడితో Premom యాప్ ద్వారా వర్చువల్ కన్సల్టేషన్ను షెడ్యూల్ చేయడం మంచి తదుపరి దశ!
చిన్న లూటియల్ దశ: లూటియల్ ఫేజ్ డెఫిషియెన్సీ చార్ట్ ఉదాహరణ
ఈ చార్ట్ అసాధారణమైన BBT హెచ్చుతగ్గులను చూపుతుంది, ఇది స్త్రీ సెక్స్ హార్మోన్ అసమానతలు లేదా థైరాయిడ్ సమస్యలకు సంబంధించినది కావచ్చు, కాబట్టి అండోత్సర్గము సంభవించిందో లేదో గుర్తించడం కష్టం. లూటియల్ ఫేజ్ లోపం ఉండటం కూడా అంతే ముఖ్యమైనది.
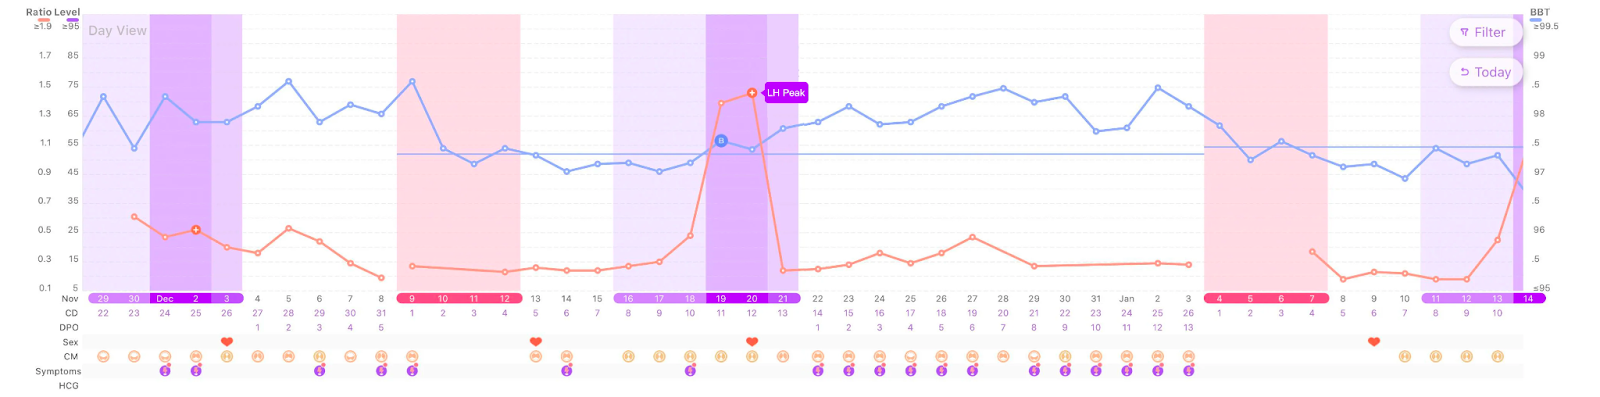
ఊదా మరియు ఎరుపు మధ్య చక్రం యొక్క భాగాన్ని చూసినప్పుడు, అనుమానిత అండోత్సర్గము తర్వాత కేవలం 5 రోజుల తర్వాత కాలం ప్రారంభమవుతుంది. గర్భం ధరించడానికి ప్రయత్నిస్తున్నప్పుడు ఇది సమస్యాత్మకంగా ఉంటుంది, ఎందుకంటే మీ పీరియడ్స్ను ప్రారంభించే ఇన్ఫ్లమేటరీ క్యాస్కేడ్ మీ పీరియడ్స్ వాస్తవానికి ప్రారంభమయ్యే కొన్ని రోజుల ముందు ప్రేరేపిస్తుంది. 10 రోజుల కంటే తక్కువ నిడివి ఉన్న లూటియల్ దశ రుతుక్రమం ప్రారంభమయ్యే ముందు ఫలదీకరణం చేసిన గుడ్డు సరిగ్గా అమర్చడానికి తగినంత సమయాన్ని అందించదు.
ఈ ఉదాహరణ మీలాగే అనిపిస్తే, మీ ప్రొజెస్టెరాన్ స్థాయిలను తనిఖీ చేయడానికి లేదా సంతానోత్పత్తి ఎంపికలను చర్చించడానికి మీ డాక్టర్తో మాట్లాడండి. మీ చక్రాలను పొడిగించాలనే ఆశతో ఇంటిగ్రేటివ్ వైద్యులు తరచుగా Vitex లేదా సీడ్ సైక్లింగ్ వంటి మూలికలను సిఫార్సు చేస్తారు.
మీ చార్ట్ గురించి ప్రశ్నలు ఉన్నాయా? ప్రేమమ్ సహాయం చేయగలదు
ఆశాజనక, ఈ ఉదాహరణ చార్ట్లు మీ చార్ట్లను మెరుగ్గా చదవడంలో మరియు సంతానోత్పత్తి మరియు వంధ్యత్వానికి సంబంధించిన సంకేతాలు మరియు లక్షణాలను అర్థం చేసుకోవడంలో మీకు సహాయపడతాయని ఆశిస్తున్నాము.
మీ చార్ట్ గురించి మీకు ఏవైనా ప్రశ్నలు ఉంటే, మీరు సంతానోత్పత్తి నిపుణుడితో వర్చువల్ సంప్రదింపులను బుక్ చేసుకోవచ్చు మరియు మీకు అవసరమైన సమాధానాలను నేరుగా పొందవచ్చు ప్రేమోమ్ యాప్. మా నిపుణులు మీతో మాట్లాడేందుకు వేచి ఉన్నారు.
ప్రస్తావనలు
- https://www.ncbi.nlm.nih.gov/books/NBK279054/
- https://www.shadygrovefertility.com/blog/fertility-health/the-most-common-cause-of-female-infertility-problems-ovulation
- https://www.todaysparent.com/getting-pregnant/trying-to-conceive/what-are-your-odds-of-getting-pregnant-each-month
- https://www.ncbi.nlm.nih.gov/pmc/articles/PMC4037737/
- Su HW, Yi YC, Wei TY, చాంగ్ TC, చెంగ్ CM. అండోత్సర్గము యొక్క గుర్తింపు, ప్రస్తుతం అందుబాటులో ఉన్న పద్ధతుల యొక్క సమీక్ష. బయోంగ్ ట్రాన్స్ల్ మెడ్. 2017 మే 16;2(3):238-246. doi: 10.1002/btm2.10058. PMID: 29313033; PMCID: PMC5689497.