If you’ve read our blog on getting pregnant fast, then you understand how important tracking your LH levels can be when trying to conceive. However, there can be a great deal of variances in LH patterns. Some are not problematic, but other LH patterns can indicate an issue — or at least an obstacle — to conception.
The two normal patterns of LH surges are gradual onset LH peak and rapid onset LH peak. The primary difference between the two is that a gradual LH surge will slowly rise over 1-6 days of your cycle, whereas a rapid surge pattern will quickly rise in just one day!
When women were studied, it was found that 57.1% had a gradual onset greater than one day, and 42.9% of women had a rapid onset. Let’s take a look at a few charts and see how this affects testing and conception.
Rapid Surge
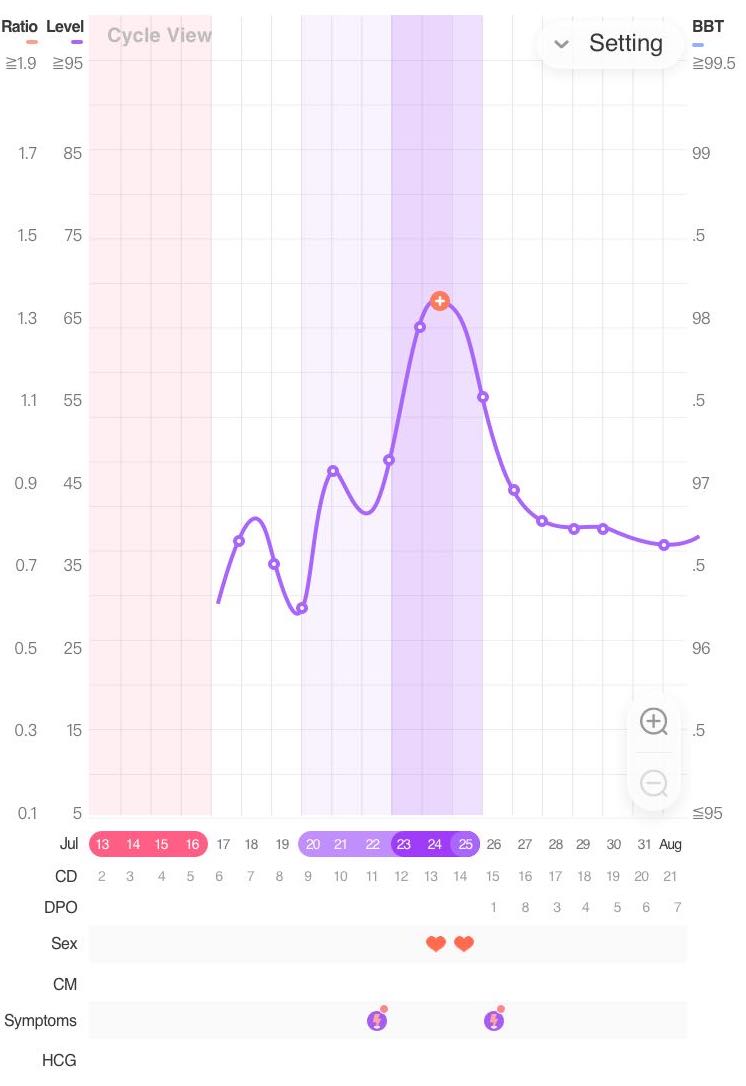
When we take a look at the chart below, we can see several days of LH (luteinizing hormone) testing without much rise and fall. However, on CD (cycle day) 13 there was an enormous spike in LH levels!

Ideally, a person with this surge type would track LH levels every day during the predicted fertile window, and potentially sooner. For those with a rapid onset LH surge, a missed day could mean a missed peak. If they’re not careful, they may not know ovulation occurred, until a BBT rise afterward indicates it. If you yourself haven’t found an LH peak, it may be a good idea to test twice daily for 1-2 cycles to ensure that you are not missing a rapid rise!
As you can see, intercourse was timed appropriately for peak day and ovulation day on CD 13 and 14. Ideally, sexual activity should be targeted throughout the fertile window (seen in purple on the graph). In this case that would include CD9 through CD15 (including the day after suspected ovulation on CD14).
This example does include some appropriately timed fertile cervical mucus or CM. Unfortunately, there is no BBT (basal body temperature) tracking included, so it would be difficult to know if the LH peak truly resulted in successful ovulation.
Gradual Surge
A gradual LH surge seems to be the most commonly referenced cycle pattern. Let’s look at this sample gradual surge chart and examine the pros and cons.
To begin, there is great daily tracking to ensure the surge is not missed. We can see that the LH levels do bob up and down at a low level for a few days, then gradually begin a steady increase CD 11-13. You’ll notice that CD 14, 15, and 16 the LH levels have lowered again so there is confidence that a peak has been found.
Again, this example includes intercourse on ovulation day and the day before, but it would be better to have intercourse well before the LH peak, starting CD9. Having sperm present before peak day helps to ensure a higher likelihood of conception.
Additionally, an odd observation about this chart is that no fertile mucus was noted prior to the LH peak. If the fertile mucus was entirely absent, then there could be an issue with the follicular phase, even with an LH peak present. BBT and PdG tracking could indicate ovulation, as hCG tracking would indicate pregnancy.
What If My LH Surge Doesn’t Fit These Patterns?
If your LH surge doesn’t seem to fit either of the above patterns, it may look something like the example chart below. Let’s take a look!
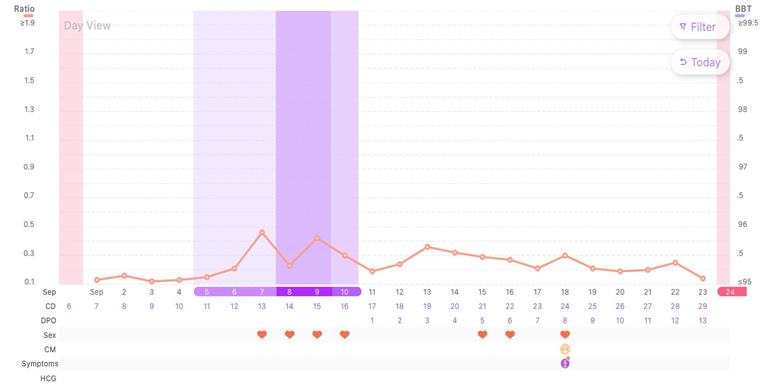
At first glance, this chart may not look abnormal. However, upon further inspection, we start to see some issues with LH.
We can see the LH was tested every day to ensure the peak was not missed. However, we can also see that there was not one significant LH peak day. On CD 13 and CD15 we get little mini peaks, but nothing monumental.
It would be a rare finding, but there is a slight chance that this user was very overhydrated on her peak days, and the LH sample was diluted so significantly that it made LH levels appear lower than they were. It’s a great reminder to keep your water intake consistent daily so that samples aren’t ultra-concentrated one day and super diluted another day.
Adding in BBT tracking is always helpful in these cases, as we could refer to a spike in BBT for indication of ovulation. Although there is no perfect LH level to trigger ovulation, the pattern of this chart indicates an unlikelihood of sufficient LH activity to trigger ovulation.
A great practice shown in this example is consistent testing! Even with minor peaks, the ovulation testing continued, to ensure that a late LH surge was not missed. Sometimes it can get tiring testing for ovulation daily, with long and drawn-out cycles, but it provides incredible information about how your body is operating — so stay strong!
There’s likely a reason that your body isn’t hormonally cycling well — or perhaps you could use some tips on how to ensure you are testing your LH, BBT and CM properly. If your chart looks like this, it may be worth a conversation with one of our fertility specialists in a Premom virtual consultation. Check out your Premom app to see all the provider types we offer.
References
https://www.ncbi.nlm.nih.gov/books/NBK279054/
https://www.shadygrovefertility.com/blog/fertility-health/the-most-common-cause-of-female-infertility-problems-ovulation