When it comes to charting for fertility, it can get complicated fast. You may sometimes feel lost with all the LH testing, BBT readings and cervical mucus observation — but you aren’t alone! There are many women trying to conceive who find this process a bit daunting. You may find yourself wondering how your chart stacks up next to a “normal” cycle chart or if your cycle looks more similar to someone with PCOS or short cycles, for example.
To begin, let’s take a look at some hypothetical chart examples that not only demonstrate a great job of cycle tracking, but also show promising results for ovulation, intercourse timing and chances of conception. We’ll break down what makes for an idyllic conception cycle and troubleshoot some common irregular chart patterns as well.
What Is Normal?
When it comes to menstrual cycles, there really is no such thing as “normal,” but we can identify what the average patterns look like that most often result in successful conception. If your cycle doesn’t match this exactly, it doesn’t mean you cannot get pregnant. It just means you have some unique variances that should be continuously monitored for optimized fertility!Cycle length tends to be between 21-35 days. LH (luteinizing hormone) tends to surge between days 10-16 on average and is where the most variance in cycle length typically exists. The luteal phase — or the second half of the menstrual cycle after ovulation — is more consistent among women and is typically around 11-16 days long.
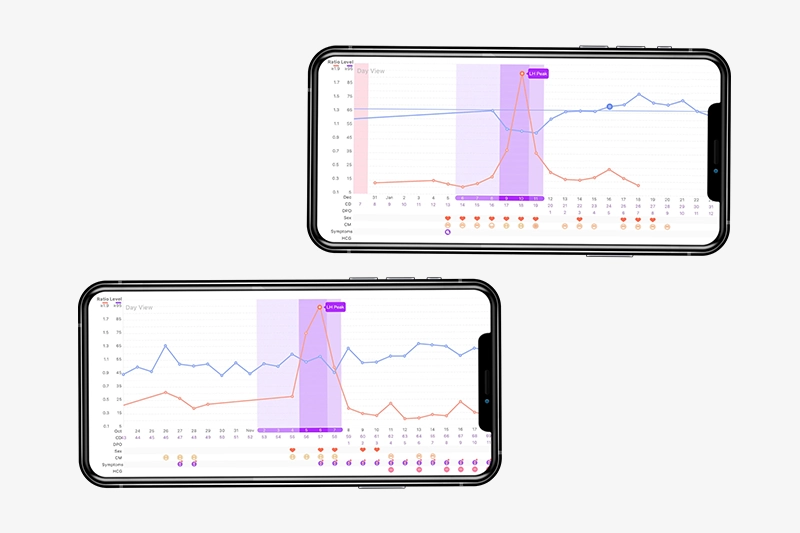
Take a look at the chart below. This example includes a 32-day cycle with a 13-day luteal phase, which tells us there would have been plenty of time for implantation of a fertilized embryo if TTC. Ovulation tests have been tracked every single day, particularly important because of the abrupt rise in LH. For those with charts like these, it can be really easy to miss peak if not diligently tracking!

Another thing that makes this cycle example gorgeous is the intercourse timing, which occurred before ovulation. With sexual activity timed as LH is rising, a woman can feel confident that sperm are present during ovulation.
The basal body temperature tracking is also very clear and consistent. This is so important, as it helps to assess ovulation occurred. If ovulation had not occurred, a woman would not be producing the hormone progesterone that makes your body temperature rise in the luteal phase.
One final thing that we can admire about this chart is the frequency of cervical mucus tracking. A close record of cervical mucus can further be assessed with the presence of egg white fertile mucus, just before and during ovulation.
Anyone who did not conceive in a cycle like would know that she did all the right things in cycle mapping, tracking and intercourse timing! It could be that a non-hormonal IUD or protection was used, or simply conception did not occur this particular cycle for unknown reasons. Remember, if you’re younger than 35, you only have a 25-30% chance of conceiving each cycle in perfect conditions, so it’s important to stay consistent with your tracking each month!
Is My Ovulation Chart Abnormal?
So, we’ve seen what an outwardly idyllic cycle looks like, but what about cycles that don’t quite look like that? Let’s take a look at a couple abnormal cycles.

For starters, this sample chart demonstrates a fantastic job tracking LH levels and BBT, and intercourse timing was adequate. We see an LH peak, which seems promising. However, when we take a closer look, there are some underlying issues.
Although we see an LH peak and a period 12 days later, you’ll notice that there is not a significant thermal shift in the luteal phase of the cycle. This minimal increase in BBT makes us suspect that although LH peaked, ovulation did not occur. This means that for some reason the brain and ovaries were not communicating well. The brain is secreting luteinizing hormone (LH) telling the ovaries to ovulate, but for some reason the egg is not actually being released this cycle.
Negative results for progesterone test strips this cycle would further substantiate our suspicion that there was no ovulation.
Pregnancy tests are also included. Note that hCG testing is shown in the chart to start just 4 days past suspected ovulation, but typically hCG levels will not be detected until about 10-12 days post ovulation.
What could it be? PCOS? Hypothyroidism?
This cycle was extraordinarily long, lasting 70 days. Often times this cycle pattern is characteristic of PCOS or an undermanaged thyroid issue. So, while it is essential to continue tracking cycles in this example, some dietary changes — and perhaps investigation of hormone levels — might also be recommended. A good next step would be scheduling a virtual consultation through the Premom app with a fertility expert!
Short Luteal Phase: Luteal Phase Deficiency

The BBT fluctuations in this chart are abnormal, so it’s difficult to determine if ovulation occurred. This could be related to female sex hormone irregularities or thyroid issues.
Just as important, this abnormal chart example shows a common concept some women encounter called luteal phase deficiency. If we look at the portion of the cycle between the purple and the red, you’ll see that the period begins just 5 days after suspected ovulation!
This can be problematic when TTC, as the inflammatory cascade that initiates your periods triggers a couple of days before your period actually begins. If your luteal phase is less than 10 days long, there isn’t enough time for a fertilized egg to properly implant before the menstrual cascade begins.
If this example sounds like you, consider speaking with your doctor to check your progesterone levels or discuss some fertility options with them. Integrative physicians often recommend herbs such a vitex or seed cycling in hopes of lengthening your cycles. Either way, it’s best to work with an expert to ensure you are on the right track!
Have questions about your chart? Check out our Premom fertility specialists for a virtual consultation through the Premom app on your phone!
Sources: